 Tessel libraries
Maps for Tessel apps:
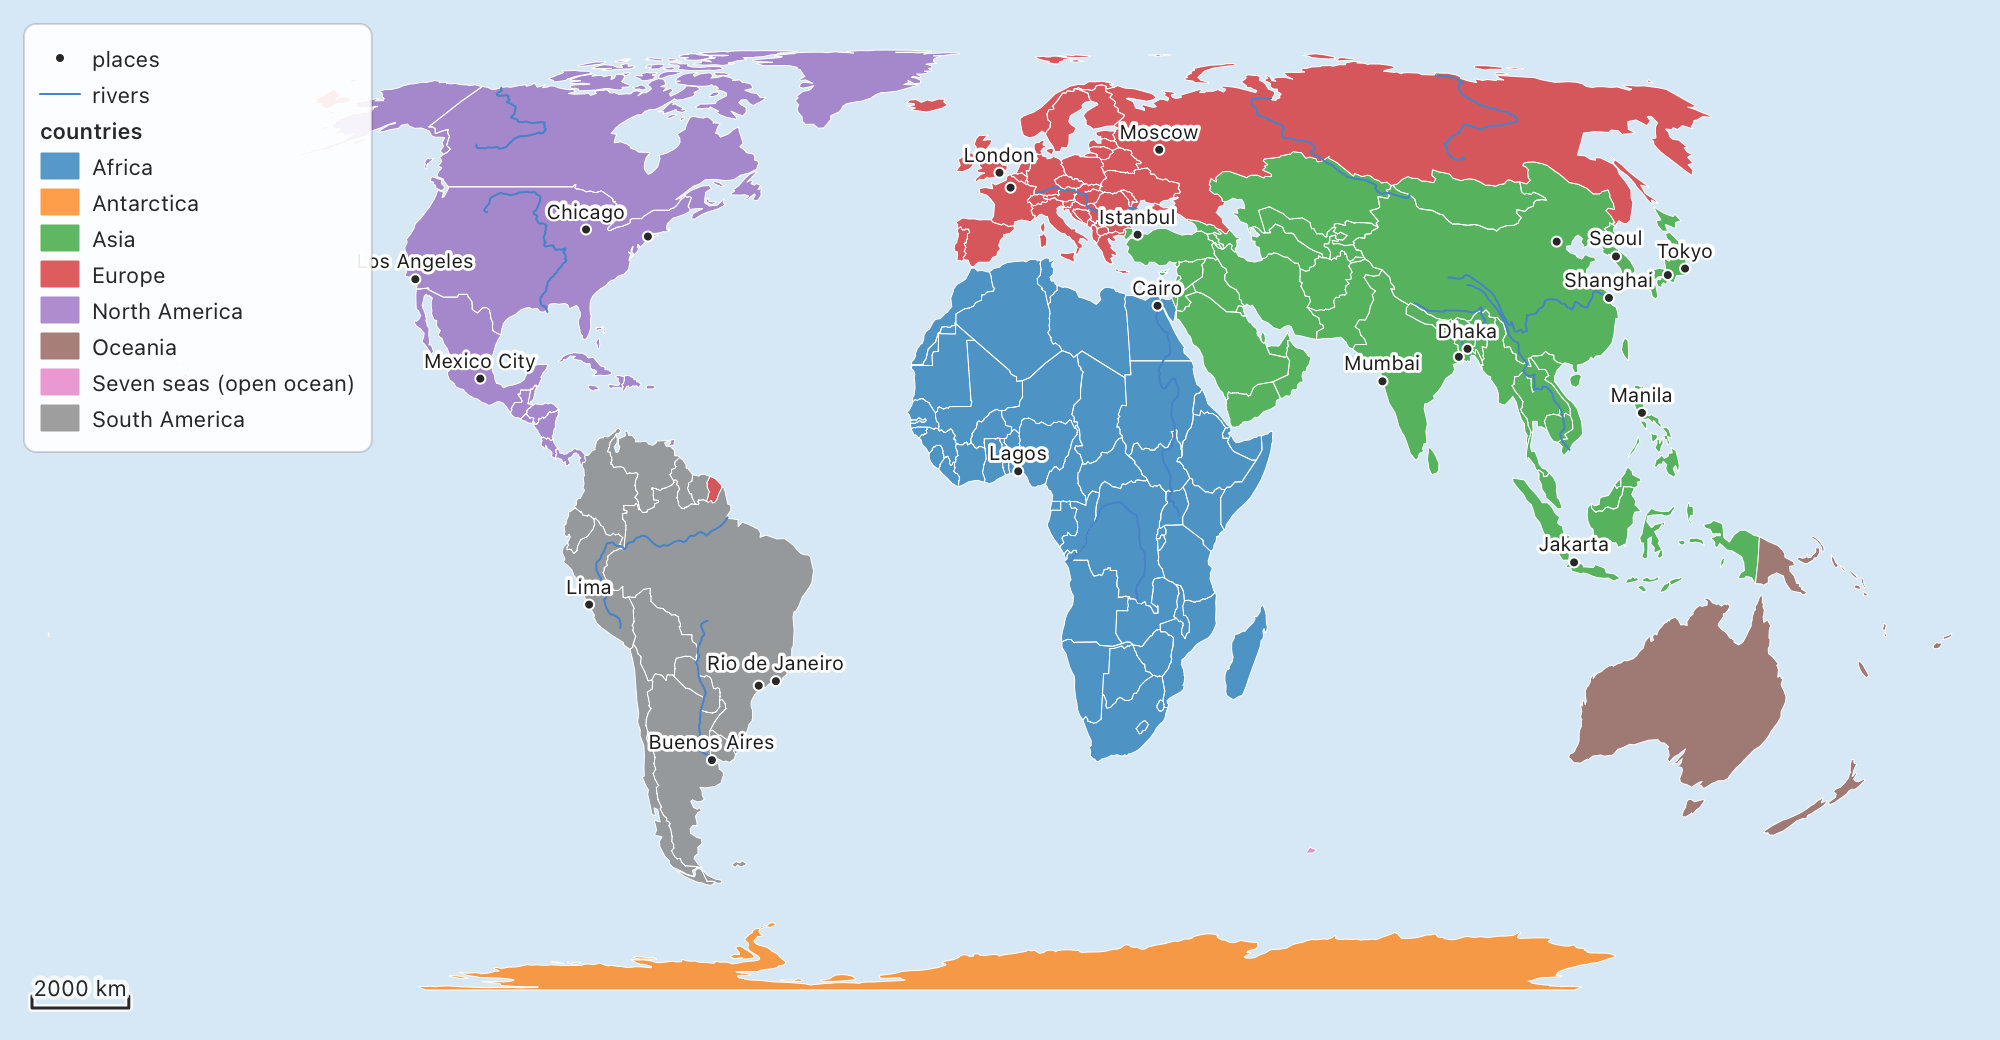
- vector layers with styles, labels and legends;
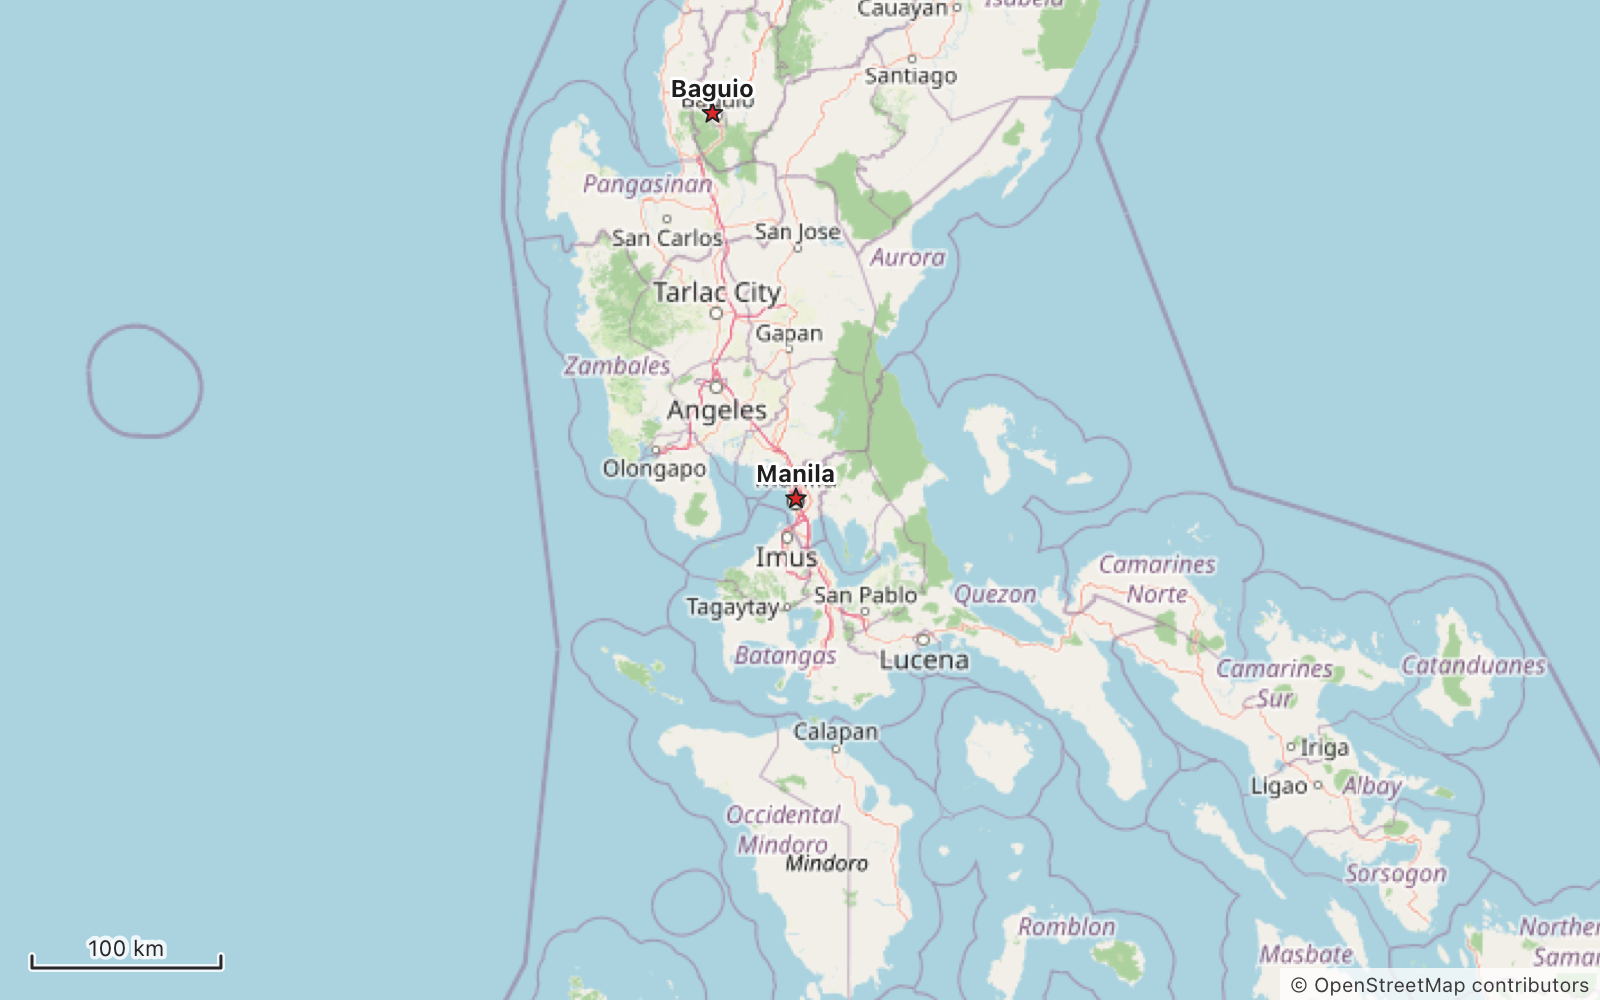
- basemap tiles (OpenStreetMap and other keyless sources) that work in any coordinate system;
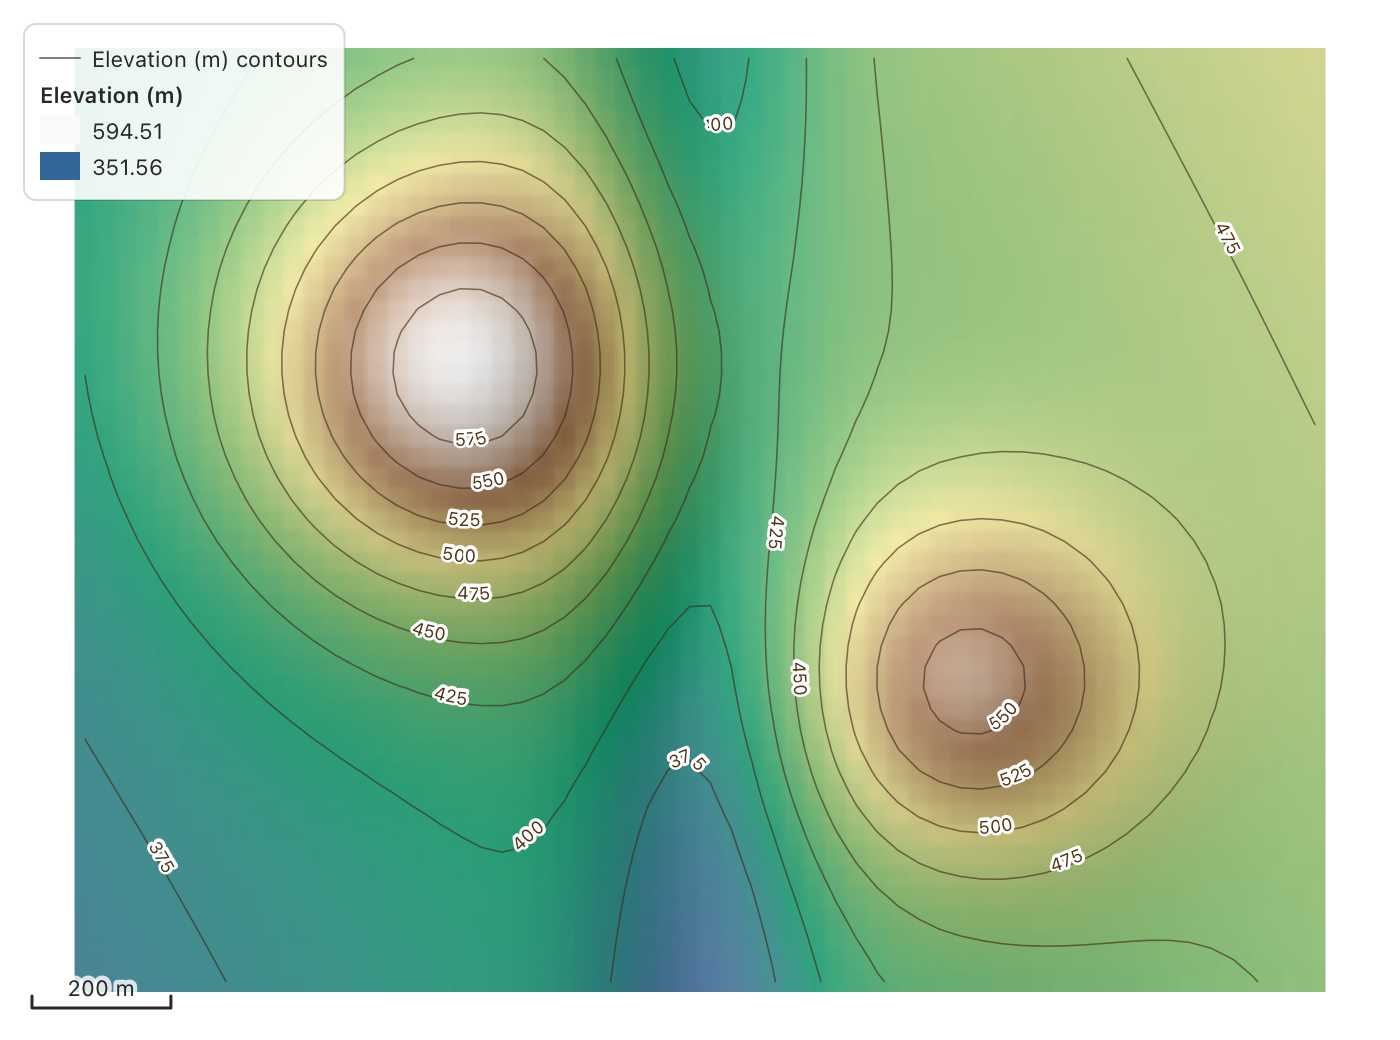
- rasters with color ramps, hillshade and contours;
- GeoJSON, Shapefile, GeoPackage, KML, GPX, CSV, WKT/WKB and GeoTIFF files.
There's a ready-made MapView for apps. You can also draw a Map on a
Canvas of your own.
tessel add cartography
It uses geodesy for coordinate
systems and viewport for panning and
zooming. tessel add brings both in. To call them yourself (geodesy.epsg(…)),
add them to your project too.
A map in an app
import cartography

fn startingMap() -> cartography.Map {
    var m = cartography.Map()                       // Web Mercator, unless you give it a crs
    m.add(cartography.openStreetMap())
    if let layers = cartography.readLayers("parcels.gpkg").value() {
        for layer in layers {
            m.add(layer)                            // reprojected into the map's system
        }
    }
    m
}

app Parcels(title: "Parcels", width: 900, height: 600) {
    state m = startingMap()
    state picked = ""

    VStack(spacing: 0) {
        cartography.MapView(map: m, legend: true) { hit in
            if let h = hit {
                picked = m.attributes(h).map { p in "{p.0}: {p.1}" }.joined(separator: ", ")
            }
        }
        Text(picked).padding(8)
    }
}
MapView handles the usual map controls:
- a drag pans, and the wheel or a pinch zooms about the mouse;
- a double click fits the map, and Shift with a drag zooms into a box;
+,−and⤢buttons zoom in, zoom out and fit;- clicking a feature selects it and hands it to your block;
- the scale bar is on by default, and the north arrow and legend are options;
- tiles download as you move.
Its parameters are scaleBar, zoomButtons, northArrow, legend,
imperial (feet and miles), selects, keys (arrows and +/− keys), and
onMouse (gets the longitude and latitude under the mouse).
The Map
A Map holds:
layers(the first one is drawn at the bottom);crs, the system it's drawn in (ageodesy.Crs);vp, aviewport.Viewportsaying which part shows. It pans, zooms, turns and moves smoothly.
add(layer), insert(_:at:), remove(at:), move(from:to:), layerIndex(named:) |
Layers. add reprojects into the map's system. |
refresh(i), refreshAll() |
Call after changing a layer's shapes, values, style or labels. |
setCrs(c) |
Draws the map in another system, keeping its place. Tiles are warped to fit. |
fit(box), fitAll(), fitLayer(i), centerOn(lon:lat:scale:) |
Where the map looks. |
scaleDenominator(), setScaleDenominator(n) |
The scale 1:N (96 points to the inch), measured on the ground. |
toLonLat(sx, sy), fromLonLat(lon, lat), toMap, toScreen, visible() |
Moving between the screen and the map. |
featuresAt(sx, sy), featureAt, featuresIn(layer:x1:y1:x2:y2:), attributes(hit) |
Finding features. |
select(layer:rows:), clearSelection() |
Selections, drawn in yellow. |
draw(g), savePicture(path, width:height:) |
Drawing it. |
To draw a map in your own Canvas instead of MapView, call
m.vp.resize(w, h) from .onResize, pass pointer events to
m.vp.handle(e), call m.draw(g), and add drawLegend, drawMapScaleBar
and drawNorthArrow where you want them. For tiles, call fetchTiles after
the view changes; the comment at the top of tiles_fetch.tsl shows how.
Layers and styles
A vector layer has a geomKind (.point, .line or .polygon), one
Geometry and one row of columns for each feature, and a crs.
var towns = cartography.Layer(name: "Towns", geomKind: .point)
towns.geoms = [cartography.pointGeometry(121.0, 14.6), cartography.pointGeometry(120.6, 16.4)]
towns.columns = [cartography.textColumn(name: "name", values: ["Manila", "Baguio"])]
towns.style.symbol = cartography.Symbol(fill: cartography.rgb(30, 90, 200), size: 10, marker: .star)
towns.labels = cartography.LabelStyle(enabled: true, field: "name")
m.add(towns)
- Symbols:
- markers: circle, square, triangle, diamond, cross, x, star, pentagon, hexagon or arrow, or a PNG/JPEG/SVG picture;
- lines: dashes, a casing and arrow heads, with markers along them if you like;
- polygons: a solid fill or one of six hatches.
- Sizes and turns can also come from fields.
- Styles:
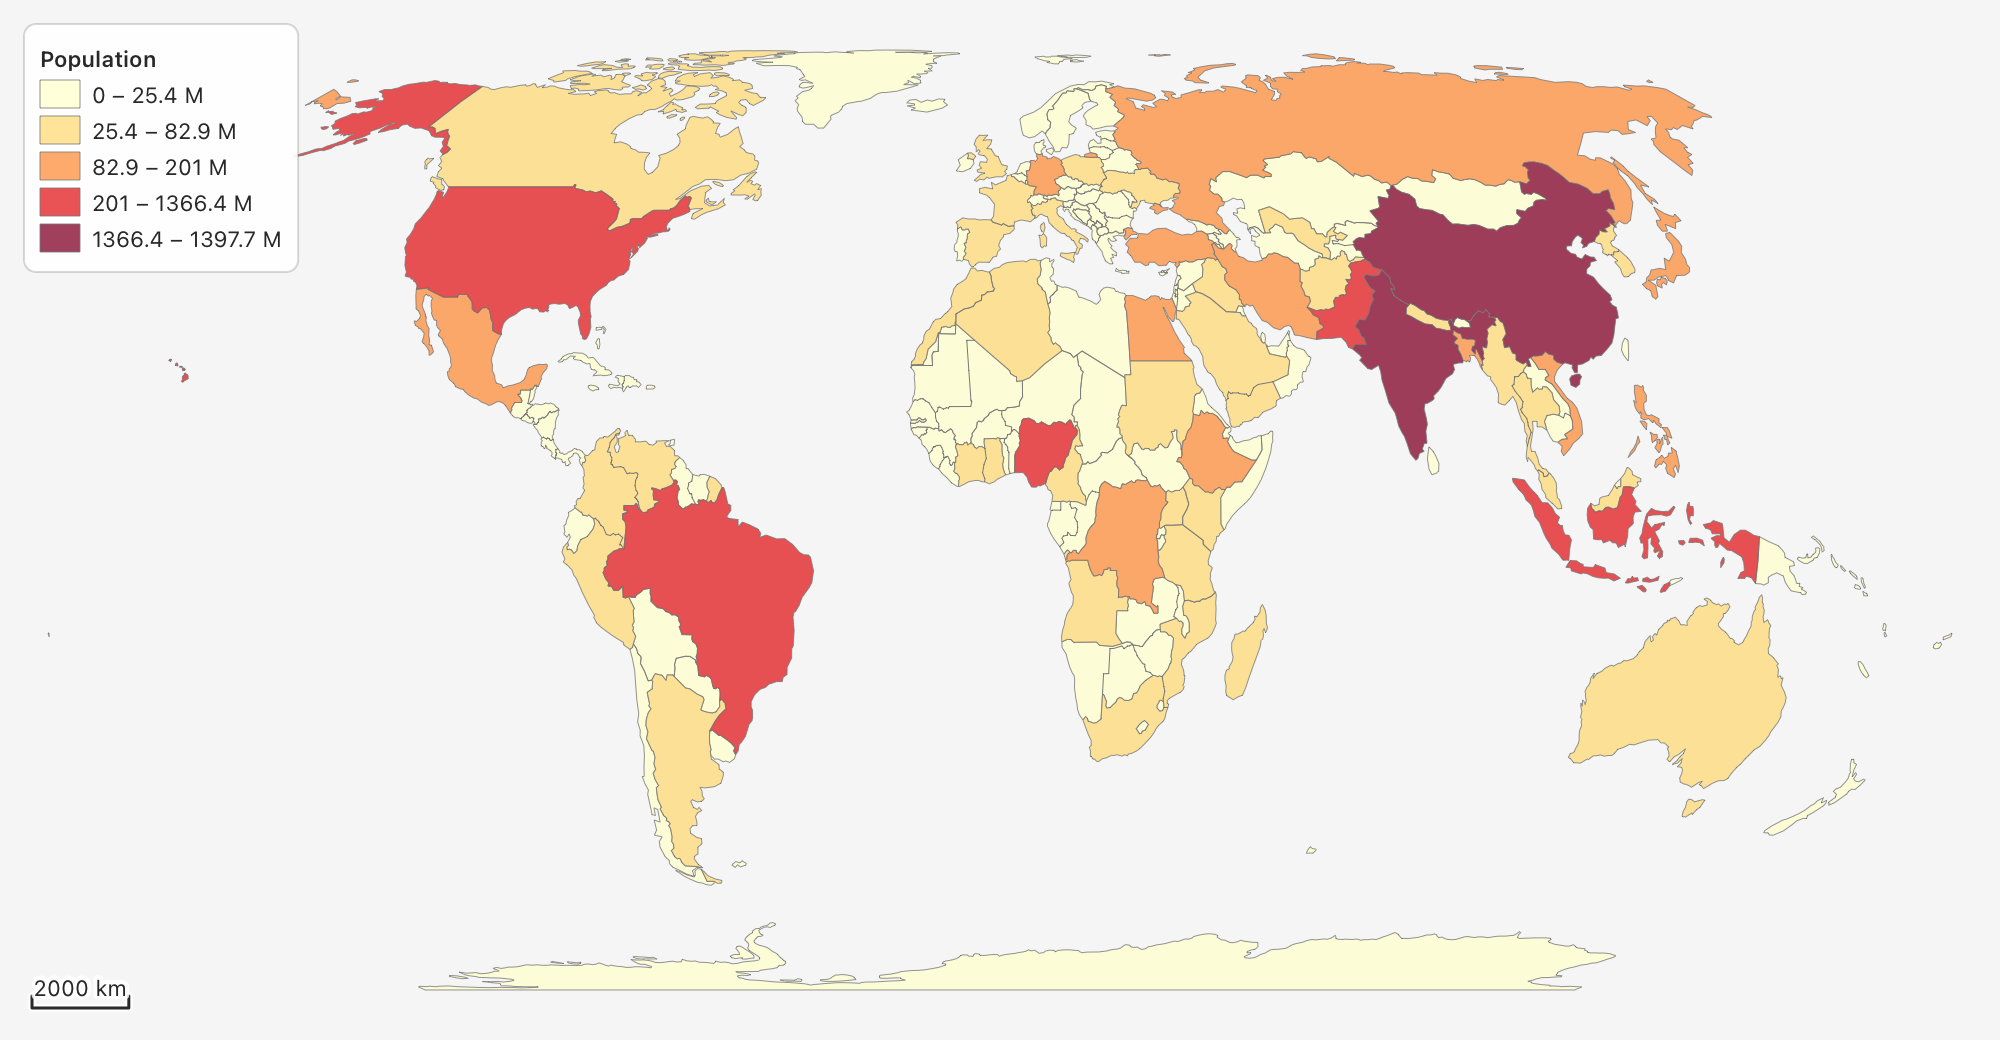
categorizedStyle(layer:field:)gives one class per value.graduatedStyle(layer:field:mode:count:ramp:)makes classes by equal intervals, quantiles, natural breaks (Jenks) or pretty breaks.- Color ramps include Viridis, Magma, Turbo, Blues, YlOrRd, RdYlGn,
Spectral, Terrain and more (
rampNames()).
- Labels: where there's room, with halos. They sit above, below or
beside points, run along lines (or bend along them with
curved), sit inside polygons, and can wrap, have a box behind them, and show only between two scales. - Filters: set
hiddento leave features out of the drawing and out of searches. - Scales:
minScaleandmaxScalelimit when a layer shows.
Files
readLayers(path) reads any supported file by its extension.
writeLayer(layer, path) writes a vector layer.
| Format | Read | Write |
|---|---|---|
GeoJSON (.geojson, .json) |
readGeoJSON(text) |
geoJSON(layer) (WGS 84) |
Shapefile (.shp + .dbf, .shx, .prj, .cpg) |
readShapefile(path) |
writeShapefile(layer, path) |
GeoPackage (.gpkg) |
readGeoPackage(path) |
writeGeoPackage(layers, path) |
| KML | readKML(text) |
kml(layer) |
| GPX (waypoints, routes, tracks) | readGPX(text) |
gpx(layers) |
| CSV (x/y or WKT columns, guessed) | readCSV(text, x:y:wkt:crs:) |
csv(layer) |
| WKT / WKB | geometryFromWkt, readWKT, geometryFromWkb |
wkt(g), wktLines(layer), wkb(g) |
| GeoTIFF | readGeoTIFF(path) |
writeGeoTIFF(layer, path) |
ESRI ASCII grid, SRTM .hgt, PNG/JPEG + world file |
readAsciiGrid, readHGT, readWorldPicture |
writeAsciiGrid |
- How results come back: readers give
Results with errors that say what's wrong, and writers giveError?. - Several layers from one file: a file with several kinds of shape gives one layer per kind.
- Coordinate systems: layers keep their file's system (from
.prj, a GeoPackage'ssrs_idor GeoTIFF keys), andMap.addreprojects them. - GeoTIFF support: strips and tiles; no compression, LZW, Deflate or PackBits; 8 to 64 bits, integer or float; several bands; no-data values.
Rasters
if let read = cartography.readRaster("dem.tif").value() {
    var dem = read
    dem.rasterStyle = cartography.rampRasterStyle(dem, ramp: "Terrain")
    dem.opacity = 0.75                              // the hills show through
    m.add(cartography.hillshade(dem))
    m.add(dem)
    m.add(cartography.contours(dem, interval: 25))
}
- Looks: gray, ramp (named or your own colors, in steps or smooth, with gamma and invert), hillshade, or RGB from three bands.
- Coordinate systems: a raster in another system is warped into the map's.
- Terrain:
hillshade,slopeandaspectfollow gdaldem (Horn's method).contoursgives a line layer with anelevcolumn. - Values:
rasterValuegives a cell's value at a map point. There are alsorasterStatistics,rasterHistogram,sampleRasterandzonalStatistics.
Basemap tiles
- Sources:
openStreetMap();tileLayer(s)for any oftileSources(): OSM, OSM Humanitarian, OpenTopoMap, CARTO Positron, Dark Matter and Voyager, Esri imagery, street and topo, and USGS;xyzLayer(url:…)for any{z}/{x}/{y}address;wmsLayer(service:layers:)for WMS.
- Attribution: each layer carries its source's attribution, and the map shows it in the corner.
- Downloads: tiles download a few at a time with a User-Agent naming
the library, as OpenStreetMap's tile usage policy asks. They are kept in
Map.tileFolder(a temporary folder unless you set one). - Other coordinate systems: a map not in Web Mercator gets its tiles warped into its own system.
- Your app's responsibility: a busy app should use its own tile server or a paid service. OpenStreetMap's servers are for light use.
Coordinate systems
A map can be drawn in any system geodesy knows: EPSG codes, PROJ strings or
WKT (geodesy.epsg(32651), geodesy.crs("+proj=…")). webMercator() and
lonLat() are the two common ones. transformCoords and reprojected move
coordinates and shapes between systems.
Tests and examples
tessel test testsruns 138 tests: the core, plus each part checked against an outside oracle.- Formats: GDAL through pyogrio, and shapely.
- Tiles: mercantile.
- Rasters: GDAL through rasterio, gdaldem and contourpy.
tools/oracle/holds the generators that make the expected values. They need a Python venv in.venv/withpyogrio shapely pyproj mercantile rasterio numpy contourpy matplotlib.tessel run examplesopens a small app.tessel run examples/picturesdraws the pictures above.
License
MIT. Map data in the examples is from Natural Earth (public domain). The basemap picture is © OpenStreetMap contributors.